
Visualize a Spline Curve
Examine curvature of a spline curve with visualization. The visualization is visible only in the sketching mode, but the visualization settings are saved in the model. The software hides the visualization when the sketch is closed and restores it when the sketch is opened again. Edit the visualization settings from the context-sensitive menu when the curve is visualized.
Add visualization to a spline curve
- Select the spline curve.
- Select the Show curvature visualization function from the context-sensitive menu.
Remove visualization from a spline curve
- Select the spline curve.
- Select the Hide curvature visualization function from the context-sensitive menu.
Edit the visualization settings
- Select the spline curve.
- Select the context-sensitive function Visualization settings.
- Edit the visualization settings either with a slide control or entering values in the fields. It is possible to type values out of the slide control's limits in the field, for example negative height.
-
You can preview the changes in the spline curve by selecting Automatic preview.
Visualization Settings
General group:
- Height - Select a multiplier, which defines the size of the whole visualization. The default value is 10 and for example value 20 doubles the height.
- Density - Defines the number of curvature values calculated. It is affected by the given density value, the amount of tangent handles and complexity of the curve. More values are calculated for complex curves than for simple ones. Smaller density value makes the visualization more imprecise, but improves the software performance.
- Apply square root - Setting calculates the visualization from the curve's curvature values using square root. If the setting is selected, the visualization is smoother than without it.
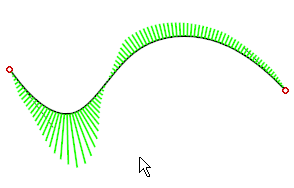
Example: The visualization density value is 50 and Apply square root setting is not selected.
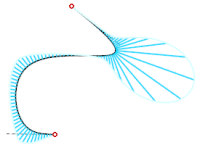
Example: The visualization density value is 30 and Apply square root setting is selected.

Curve settings group:
- Color - Select a color for the visualization curve from a palette or type a value in the field.
- Thickness - Edit the visualization curve's thickness.
- Show curve - Setting defines whether the visualization curve is visible.
Line settings group:
- Color - Select a color for visualization lines from a palette or type a value in the field.
- Thickness - Edit the visualization lines' thickness.
- Density - The relative density of visualization lines is a percentage between 0%-100%. For example value 33% draws every third line. The final visible amount of lines is affected by both general density and the relative density of visualization lines.