
Curve Equation (3D) - Drawing Function-controlled Curves
General
- You can use curve equations to draw function-controlled curves (splines).
- The use of this function is based on specifying the start and end points and defining an equation which the curve between the points will follow.
 Enter the value of the angle in radians.
- For example a band-like object is easy to create.
Add a curve using the equation editor
- Select the context-sensitive function
 Line >
  Curve Equation.
 - Enter the spline line feature values in the Equation Editor.
- Enter the X function.
- Enter the Y function.
- Enter the coordinates of the start point of the curve.
- Enter the coordinates of the end point of the curve.
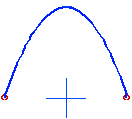
Define the equations in parametric format as functions of t X(t) and Y(t).- For example the equation Y=X**2 (i.e. X to the power of 2)
- X(t) = t
- Y(t) = t**2 (i.e. t to the power of 2)
- If the data specified in the dialog box is sensible, the Preview button is enabled and you can click it.
- Click OK to accept the curve or
- Click Cancel to cancel the drawing of the curve.
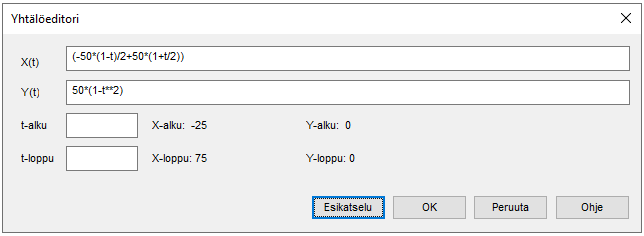
Example 1: Parabola
A parabola curve passing through three points (-50,0),(0,50)(50,0) can be defined in the dialog box as follows:
The same parabola could also be defined as follows:
- X(t) = t
- Y(t) = -0.02*(t**2)+50.0
- t-start = -50
- t-end = 50
Example 2: A cosine curve
- X(t) = t
- Y(t) = 20*cos(t)
- t-start = -6
- t-end = 6
If the data specified in the dialog box is sensible, the Preview button is enabled and you can click it.
Example 3: An equation for a hanging rope.
Editing a Curve
You can add a curve added with a curve equation as follows.
- Select the curve.
- Select the context-sensitive function Curve Equation.
- Edit curve data in the dialog box.
- Select OK.